Project impact:
160,000
hours saved
$8,2M
in net savings
Snapshot
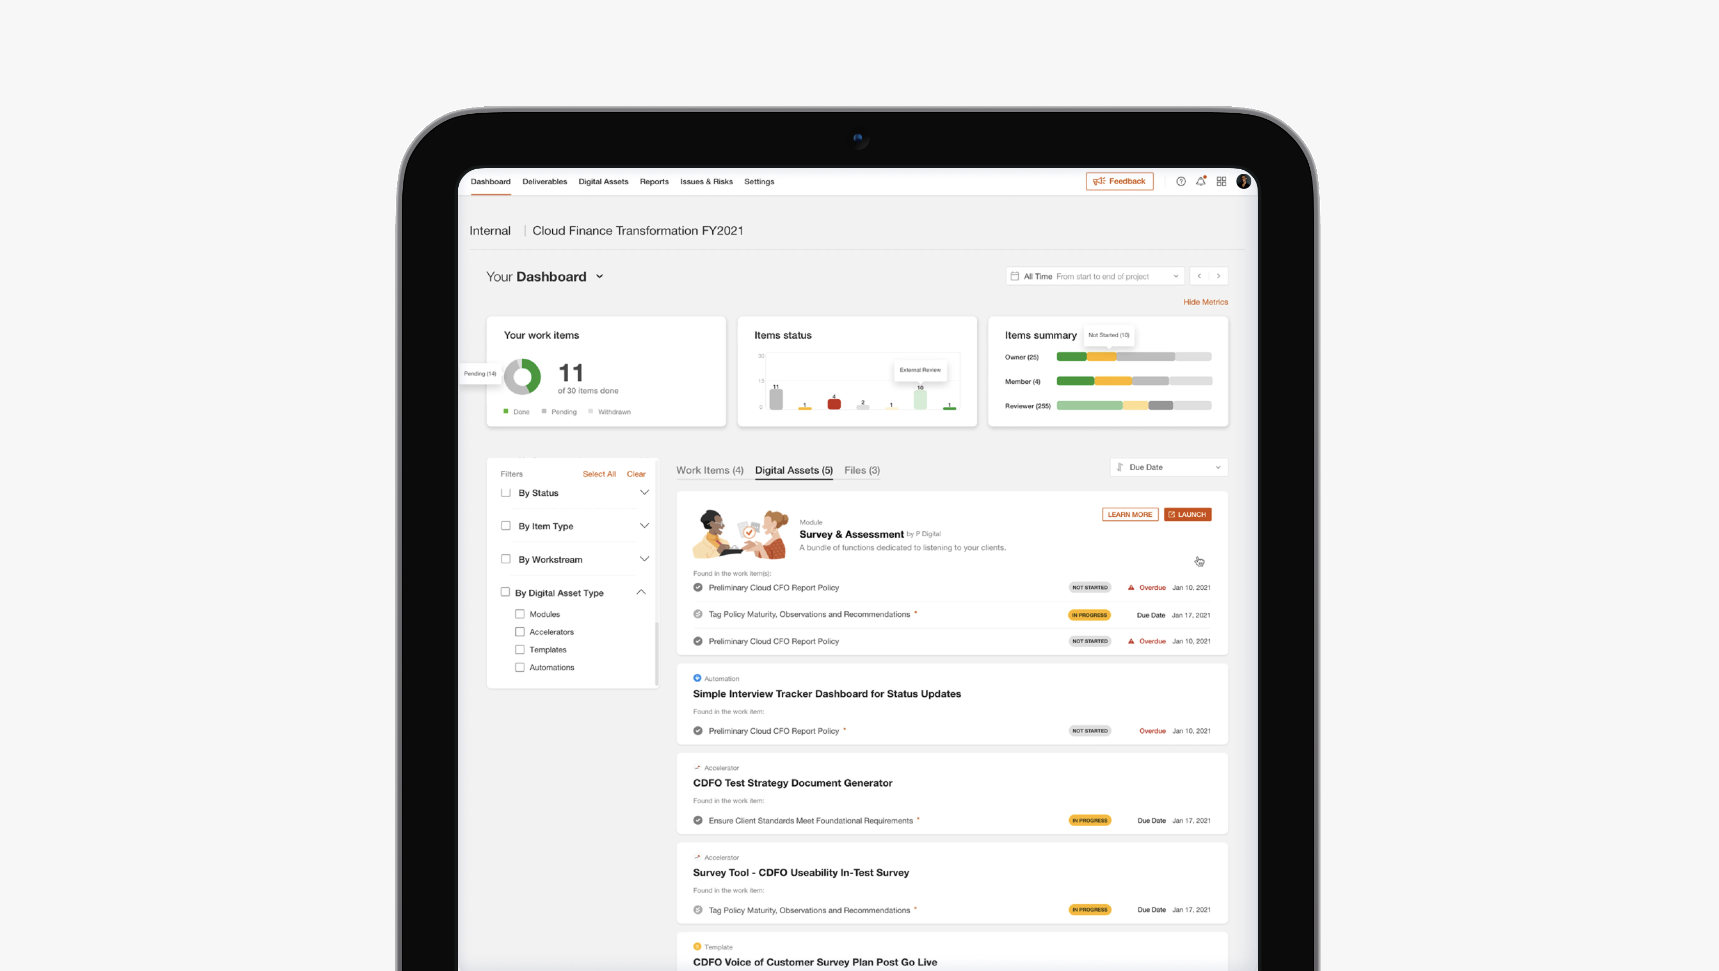
I designed the first benchmarking integration inside Concourse, PriceWaterhouseCooper’s internal delivery platform for collaboration, workflow management, and real-time engagement visibility. The goal was to help analysts spend less time retrieving, cleaning, and formatting benchmark data, and more time producing insights and recommendations for clients – which is of ultimate value.
More than just a feature, it became a blueprint for how Concourse should handle external integrations: additional authentication inside an existing session, server-to-server API workflows, data transformation visibility, storage and export of governed engagement artifacts.
Scope: end-to-end import to export journey.
Problem
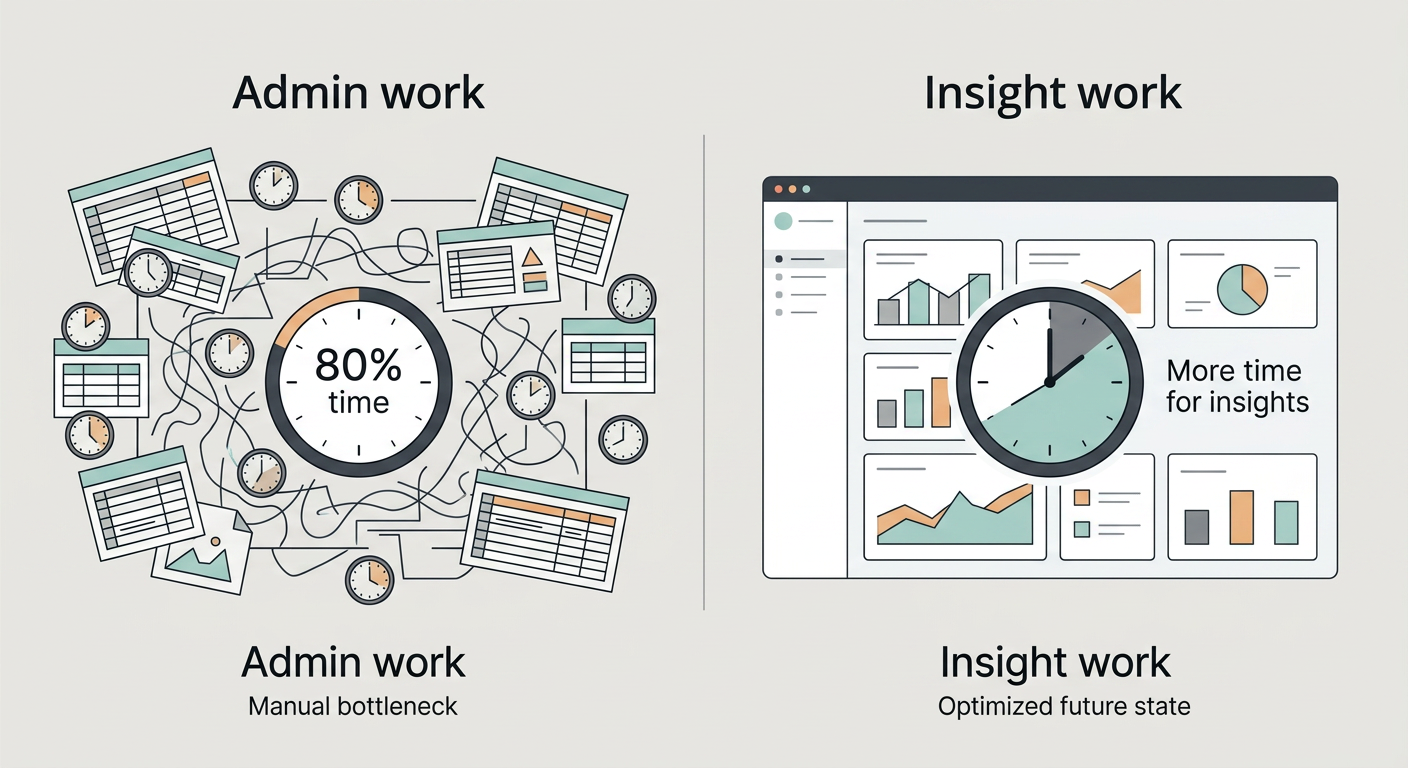
Internal research suggested analysts were spending around 80% of their time on admin-heavy tasks such as data retrieval, cleaning, mapping, file transfer and only 20% on actual analysis. The product ambition was to reverse that ratio over time by removing workflow friction, making benchmark data queryable and usable inside Concourse instead of across disconnected tools.
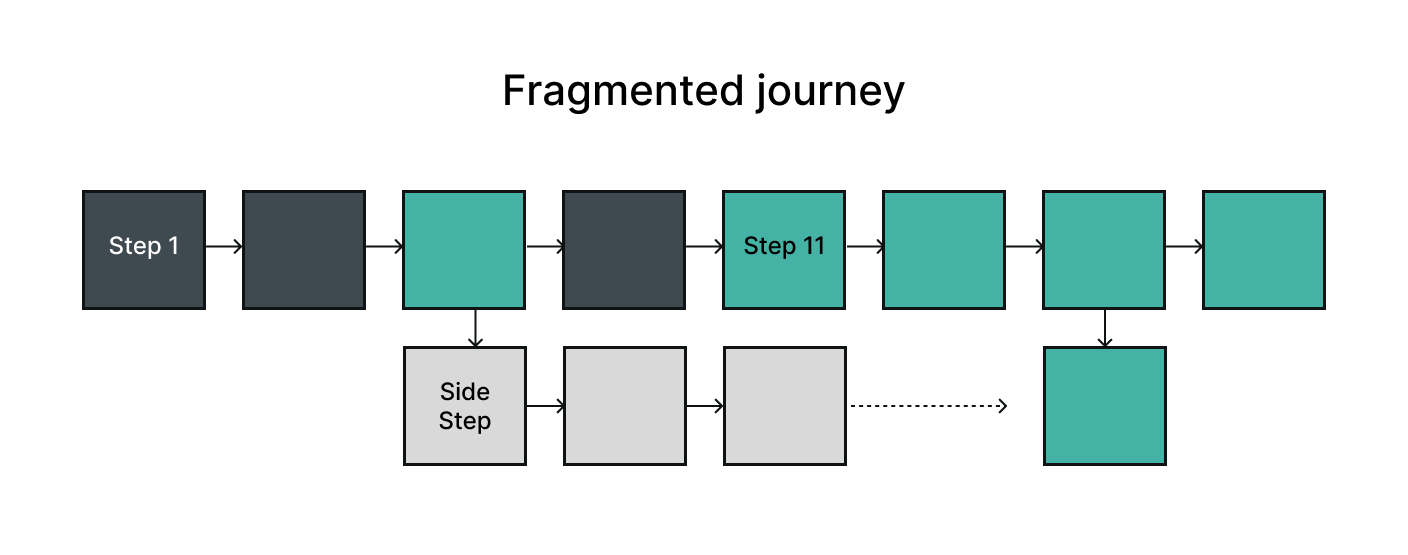
At the time, the workflow was fragmented, which made the process slow and disconnected from the platform where collaboration already happened.
Retrieve benchmark data from separate source > Clean and standardise manually > Map to engagement structures > Apply formulas in spreadsheets > Export file that supports the engagement > Upload it to the engagement repository, or to Concourse for collaboration.
Challenges
This project combined product, platform, and organisational complexity.
- It was the first integration in Concourse.
- It required the first extra authentication pattern inside an already-authenticated Concourse session.
- The server-to-server API infrastructure was being defined at the same time.
- It was that team’s first time agreeing to internal user research before launch.

The biggest non-technical challenge was that key stakeholders were not yet comfortable using user research to drive product decisions. Regional teams were often competitive, so there was little appetite for exposing an imperfect tool to internal users. To win support, I had to produce high-fidelity designs earlier than usual in order to build trust and secure permission to test properly.
Team: Product manager, Scrum master, Front-end devs, Back-end devs, QA and AI Database experts.
I reported to the Lead Designer (all modules), US Head of UX Design, and UK Head of UX & Service Design.
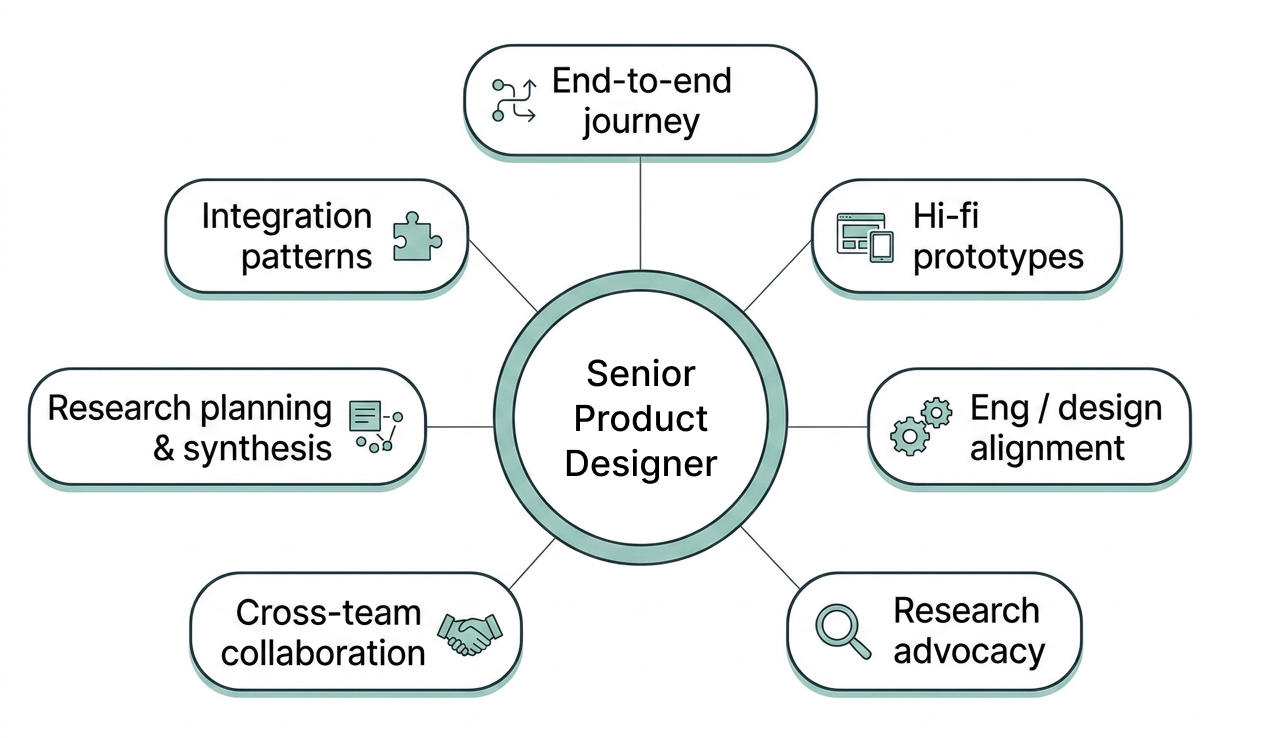
My role
I reported to the overarching lead for all Concourse modules and to the Director of User Experience. As the only designer in my module’s scrum squad, I owned the UX across the full workflow:
- Designed the end-to-end auth, import, review, and export journey.
- Created high-fidelity wireframes and prototypes for stakeholder alignment.
- Reviewed flows and early mockups with engineers to reduce rework and build time.
- Advocated for pre-launch research and continuous discovery.
- Engaged with the PwC Researchers across the pond to ensure the study quality.
- Led research planning, synthesis, and design recommendations.
- Helped define reusable patterns for future Concourse integrations.
Design Toolbox: Sketch, Zeplin, Invision, Abstract, and Miro.
Approach
Discovery
I was given access to the benchmarking tool and familiarised myself with the types of data it could surface. I explored its search criteria, filtering and sorting options, and translated those capabilities into what they should look and feel like inside the Concourse platform.
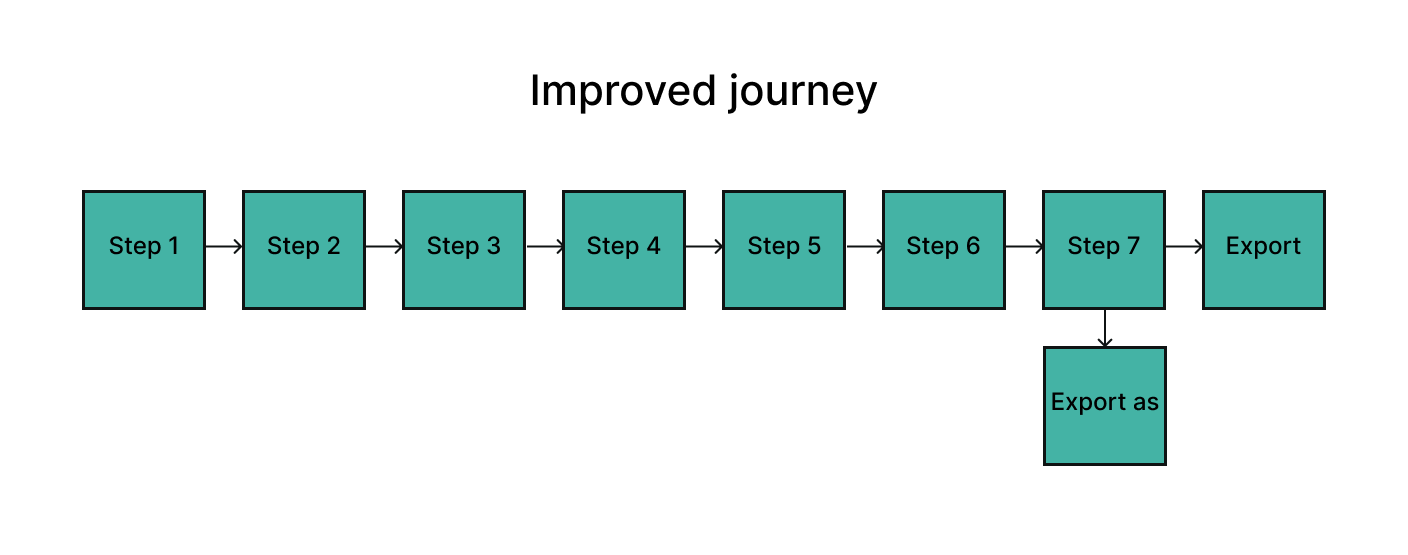
I structured the experience around clear stages to make the integration legible as a sequence of decisions rather than a black box.
Connect and authenticate > Select dataset and engagement context > Import records and insights > Review cleaning and mapping outcomes > Apply formulas and benchmark logic > Resolve exceptions > Export the final file into the engagement.
Design and development
Example design decisions: I gave analysts the option to define parsing parameters and preview the first 100 rows of data before committing to an import.
I gave analysts the option to apply formulas in-line within the same flow or reuse saved “recipes” from other engagements.
I introduced both a linear list of digital assets and a kanban‑style grid view of data files, so batches could be dragged into the next stage once processing was complete
Test and iterate (Push for evidence before launch)
Because research buy‑in was low, I used high‑fidelity prototypes as a concrete way for stakeholders to see and react to the flow before presenting the research plan. In the worst case, the team would still launch based on assumptions and treat any findings as a second‑round improvement; in the best case, I could test an interactive version with real users and feed those insights into the design before launch.
I involved the UK Research team, which was a first for this type of collaboration between the UK and US PwC teams. To address resourcing questions I framed it as an opportunity to test whether US teams would make greater use of UK research expertise in future product work.
Research Toolbox: EnjoyHQ, Miro, Google Suite (Mail, Forms, Meet)
Research
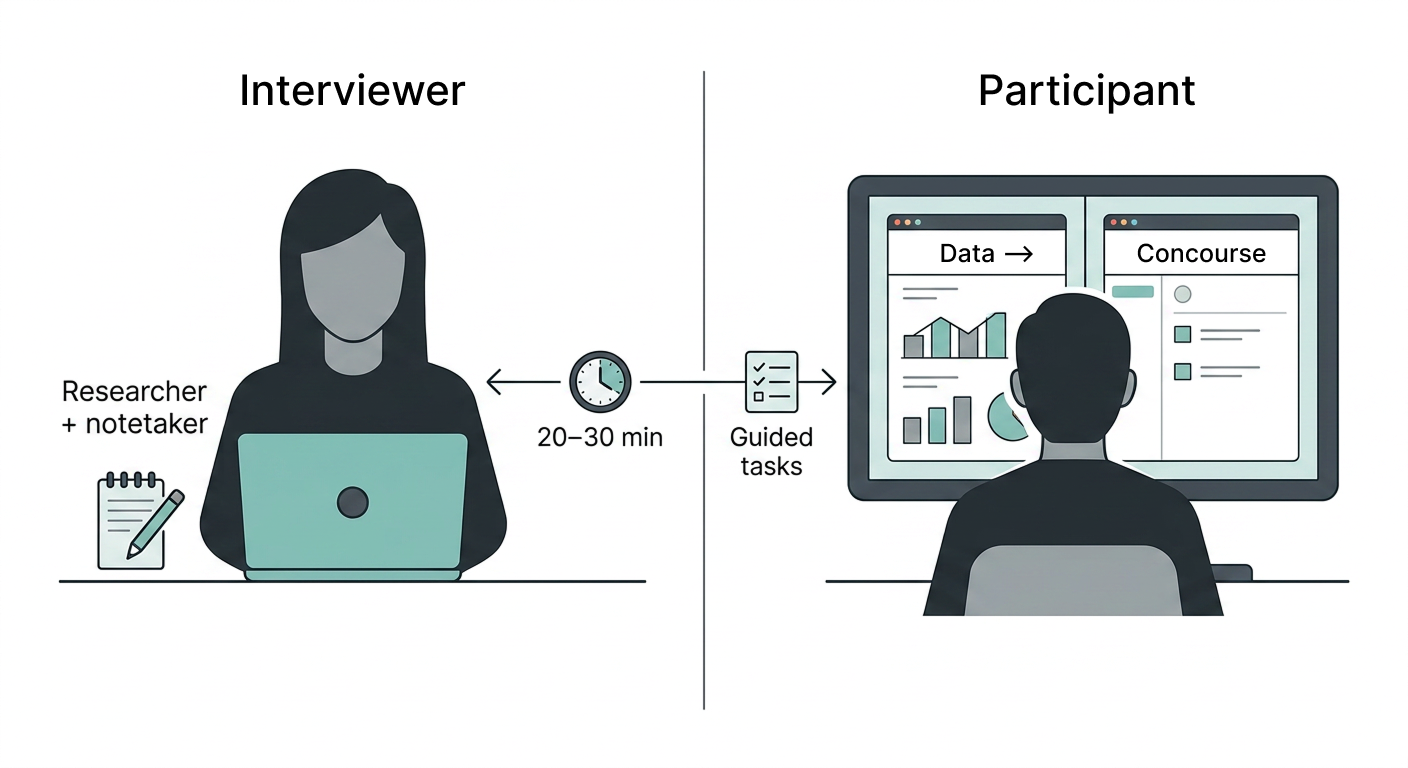
I recruited participants via an email invite linking to a short Google Form, where they described their current workflow and selected preferred time slots for the session. I then worked with developers to spin up a tailored UAT environment, using my interview script and task list as the backbone for scenarios, and paired it with high‑fidelity prototypes that were reviewed and signed off by the PMs.
We aimed to understand whether analysts grasped the integration and its stages; had enough controls while querying the data; trusted the imported and transformed data; and felt confident enough to use the exported file in a live engagement.
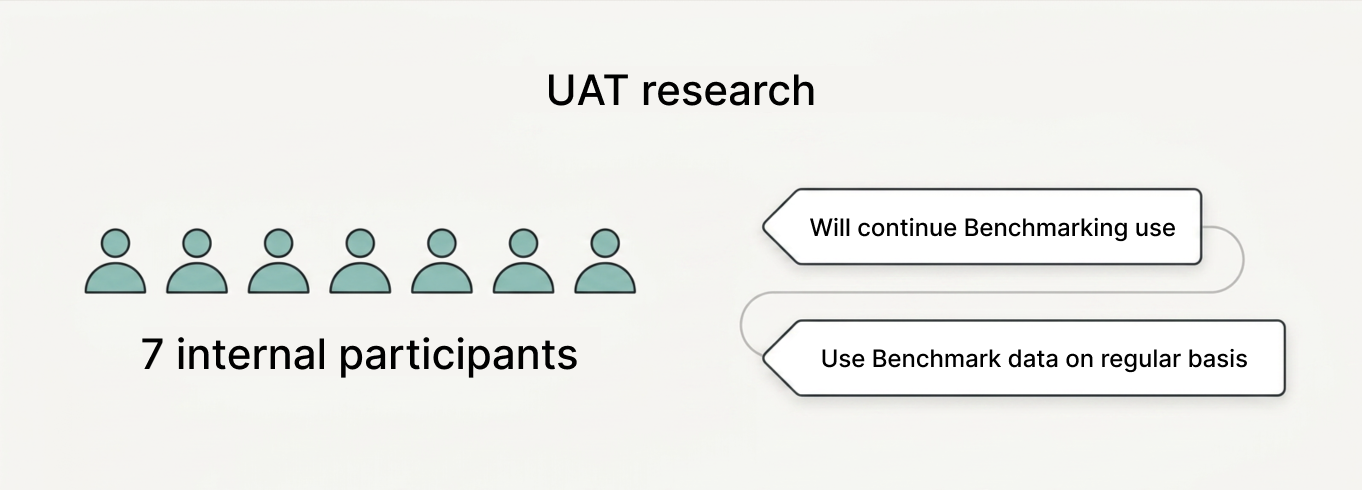
What we learned
The research validated both the value and learnability of the integration: analysts picked up the flow quickly and often began the next task before I’d finished the instructions. The interaction model felt intuitive to them, as they surfaced useful feedback on the new benchmarking flow and pointed to a few opportunities across the wider Concourse platform.
I synthesised findings in Miro (affinity clusters and a simple quadrant map) and presented them to senior stakeholders, prioritising recommendations into quick wins and broader experience themes.
Key findings included
- card UI patterns (ellipses for truncated titles vs three‑dot contextual menus)
- indecision about search defaults (design for browse-and-refine or precise-query)
- status visibility showing data batches being processed (too subtle in grid view)
- terminology and definitions such as “Ingest” for data and “Import” for files
The insights were well received and became an evidence base for UI refinements and cross-platform improvements.
Next steps
We agreed to implement quick wins first and decided which issues to address before launch versus which to defer to a second iteration. The following sprint prioritised giving analysts a visual representation / UI of data mapping and the ability to edit each connection in real time.
Note: The case study focuses on process, decisions and outcomes rather than raw deliverables, in‑progress screens or internal artefacts due to NDA.
Metrics have been verified and updated in 2026.
Outcome
Teams could now access and transform benchmarking data from within their main project management and collaboration platform, drastically reducing friction.
12%
Adoption uplift
Adoption of Concourse increased from 20% to 32% in the first 3 months post-launch of the Benchmarking module, exceeding the 10% target and adding approximately 78 adopters to 650 daily active users. Last update: Retention through month 6 indicates the lift was sustained.
160000
hours saved
$8,2M
in net savings
12%
increase in RAID activity
Impact of platform-wide improvements (all Concourse modules) during the same 6-month period amounted to: 160,000 work hours saved; $8,2 million dollars saved; and an overall 12% increase in RAID activity (people were logging, updating, and resolving risks, actions, issues, decisions and dependencies more frequently).
Why it matters
For analysts: less repetitive work and fewer handoffs between systems.
For clients: more time spent on interpretation, recommendations, and quality of insight.
For PwC: a reusable integration blueprint that could scale beyond one module.
Why it matters to me
- The project combined UX for trust and security as well as data transformation.
- The integration blueprint we created acted as a baseline for future teams.
- An intuitive, staged, progressive flow had more value than visual novelty in this case.
- Reducing invisible labour helped analysts get to the work clients actually pay for.
As the sole designer in the import‑to‑export module squad, I also helped the wider platform team open up to testing earlier, so decisions could be made with more confidence. This blend of product thinking, research advocacy, and organisational influence is what makes the project a strong example of my practice.